How Fibershed’s RFMI Ecosystem Mapping is setting the stage for designing and implementing key expansions in textile manufacturing in the Western United States
Written by Nicholas Wenner
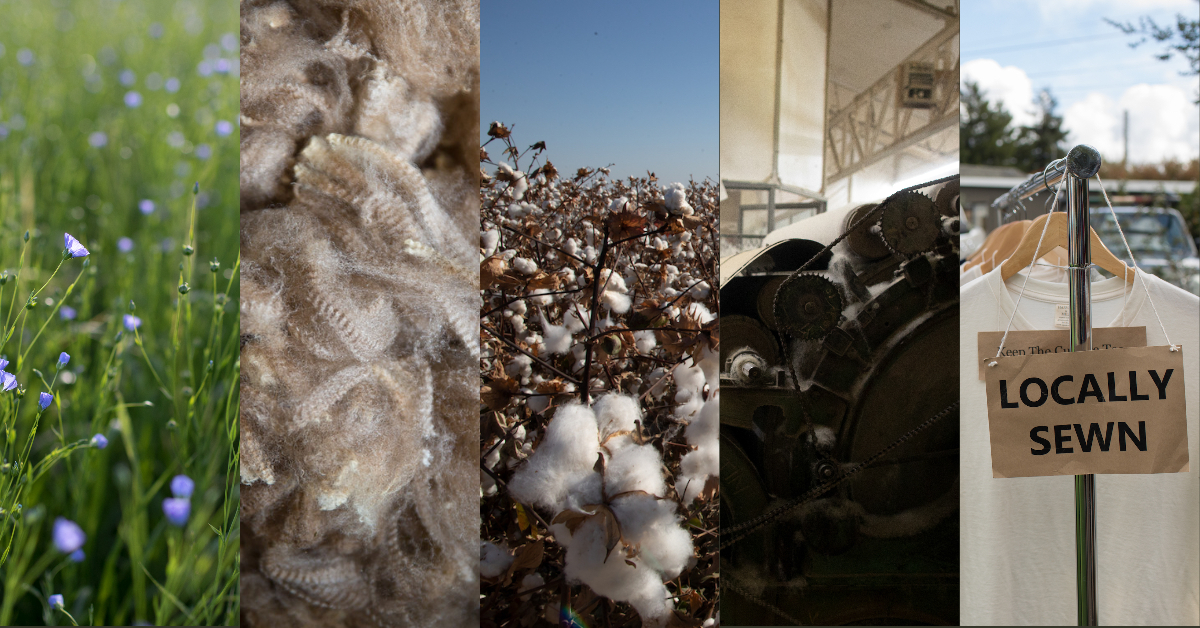
Each year, the United States produces enough wool to create millions of sweaters and enough cotton to cut and sew billions of t-shirts — so, why is it so hard to fill our wardrobes with clothes that are grown and sewn close to home? And what about hemp or flax linen fabric, clothes, and goods?
Fibershed’s Regional Fiber Manufacturing Initiative has been tirelessly researching this soil-to-skin disconnect. The first half of 2020 focused on mapping the ecosystem for the supply and processing of wool, linen, hemp, cotton, natural dyes, and hides.
Through dozens of interviews and analyzing manufacturing databases, we mapped the current footprint and capabilities of existing enterprises as well as their plans to expand. We also came to understand how gaps in regional infrastructure affect existing enterprises and create a reliance on global processors.
Fiber, Fiber, Everywhere: the current supply of natural fibers, dyes, and hides in the United States
We began our mapping efforts with an assessment of what the land, farmers, ranchers, plants, and animals currently offer in our region. Both cotton and wool are currently produced at volumes substantial enough to supply manufacturing industries, so we partnered with the non-profit Ecocity Builders to map their supply at the national level.
What we found is that after reaching a peak in 1981, wool production in the U.S. has experienced a dramatic decline, falling to about 22% of its historic high by 2019. Still, the total production of raw wool was about 25 million pounds in 2019. Since about half of the weight of raw wool is made up of lanolin, vegetable matter, and soil that is washed away during the scouring process, at that production rate, we could produce more than 12 million 1-lb wool products (such as sweaters, blankets, or felted bags) each year, not accounting for waste in production.
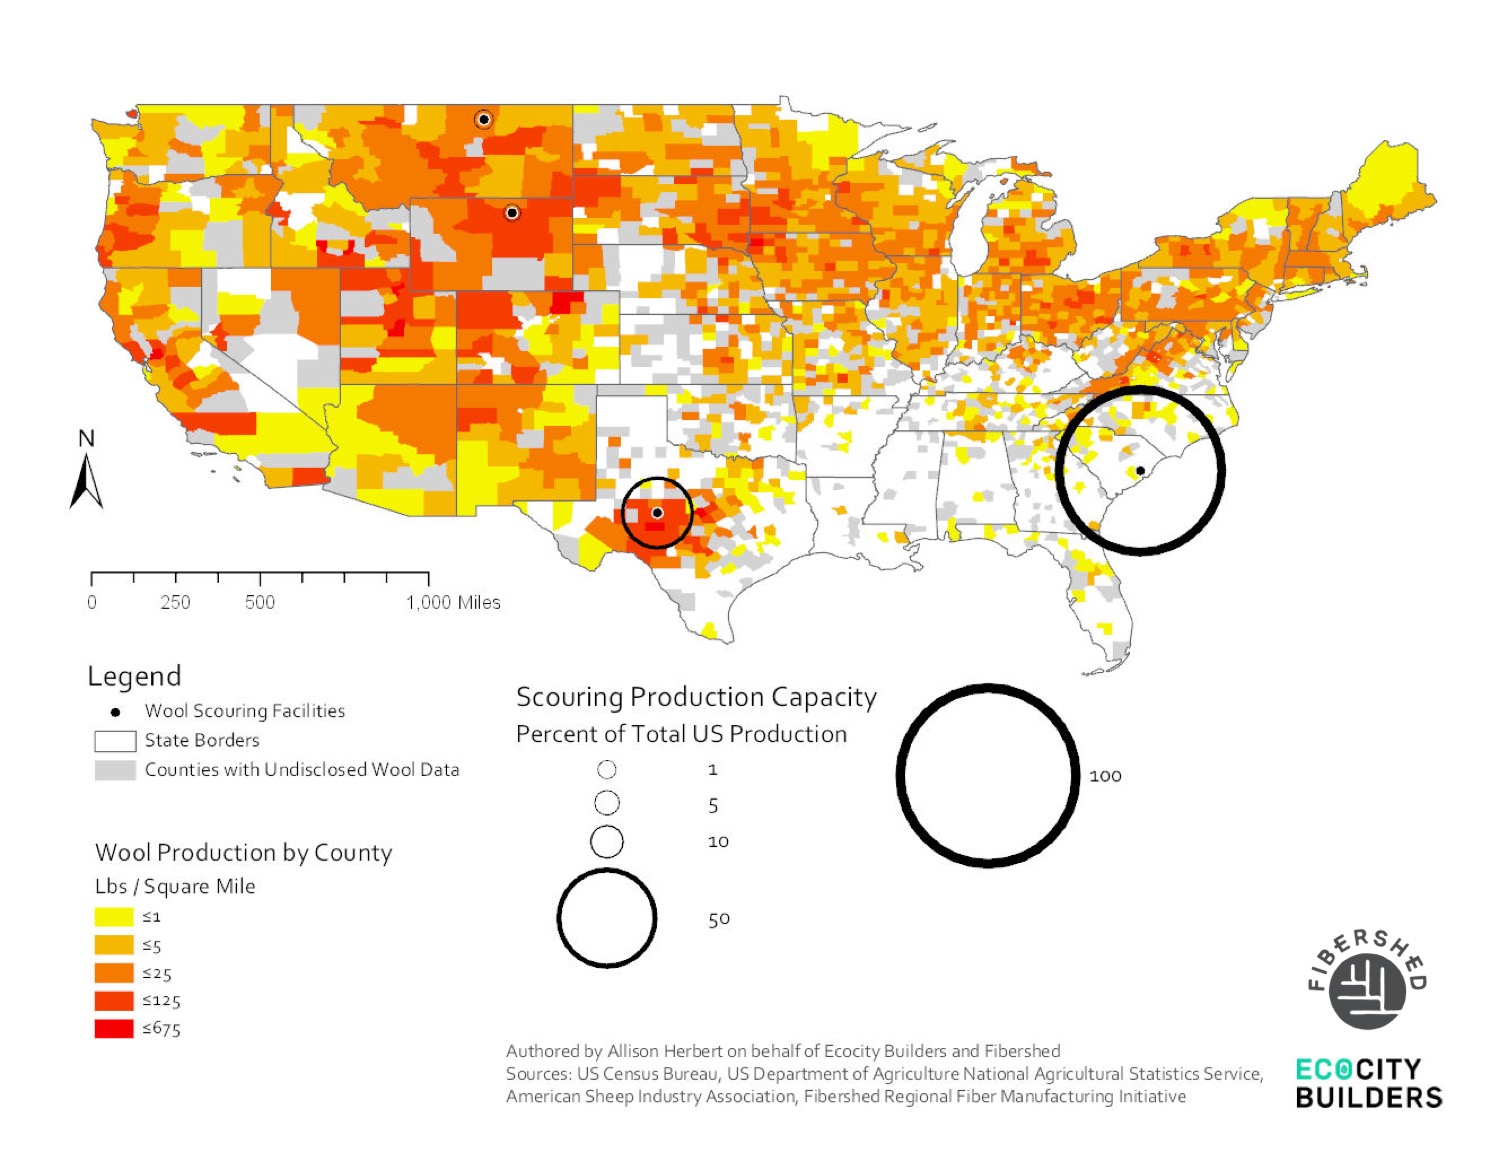
While sufficient scouring capacity exists in the United States, the majority is located far from where wool is produced, creating significant economic and environmental costs. For leather, the supply of sheep hides mirrors that of wool. At this time, we have not mapped other sources for hides such as cattle or deer or for tanning materials such as tannins from tree bark.
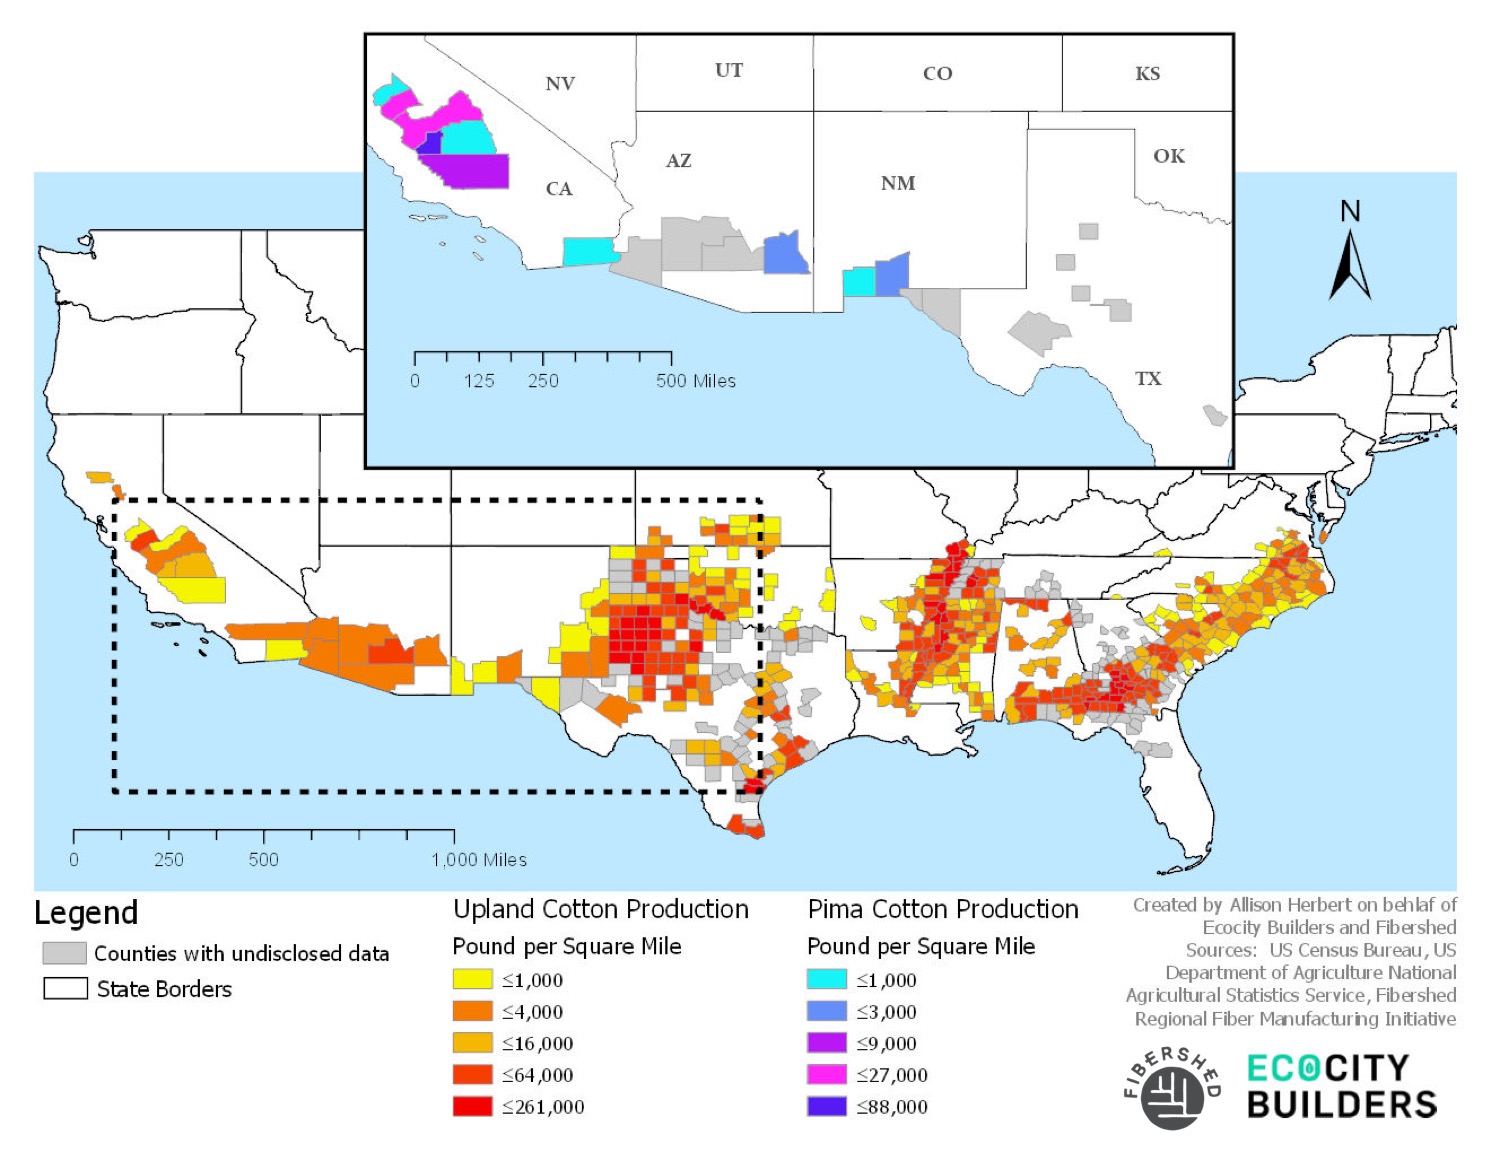
The total production of ginned cotton was about 8.8 billion pounds in 2018, 95% of which was upland cotton, a short-staple variety. Accounting for losses in production, this is enough cotton to produce about 54 t-shirts for every person in the United States. About 80% of California’s cotton production in 2018 was pima cotton, and California produced about 90% of the U.S. supply of this long-staple fiber.
Industrial supply of bast fibers is nascent in the United States. With the legalization of hemp in 2018, the landscape of hemp agriculture and processing is evolving quickly, and we have not extensively mapped the supply of this fiber source at this time. (See here for updates about Fibershed’s recent research efforts with hemp.)
Fiber flax is currently grown and processed on a small scale by groups like Chico Flax in the Sacramento Valley of California and Fibrevolution in the Willamette Valley of Oregon. Both of these groups are working to significantly increase their production in the coming years, and you can learn more about their efforts from a recent Fibershed blog here.
For natural dyes, while local materials are available through companies like Botanical Colors at a relatively small scale, industrial supply is very limited. Most notably, Stony Creek Colors in Tennessee is currently supplying and developing natural dyes at an industrial scale, focused particularly on indigo.
Minding the Gap: Textile Manufacturing Across the Western US
It takes many steps for natural fiber to go from field to closet. These steps are different for each type of fiber, though the general flow follows the need for fiber to be cleaned, aligned, spun into yarn, and made into fabric or directly into a garment.
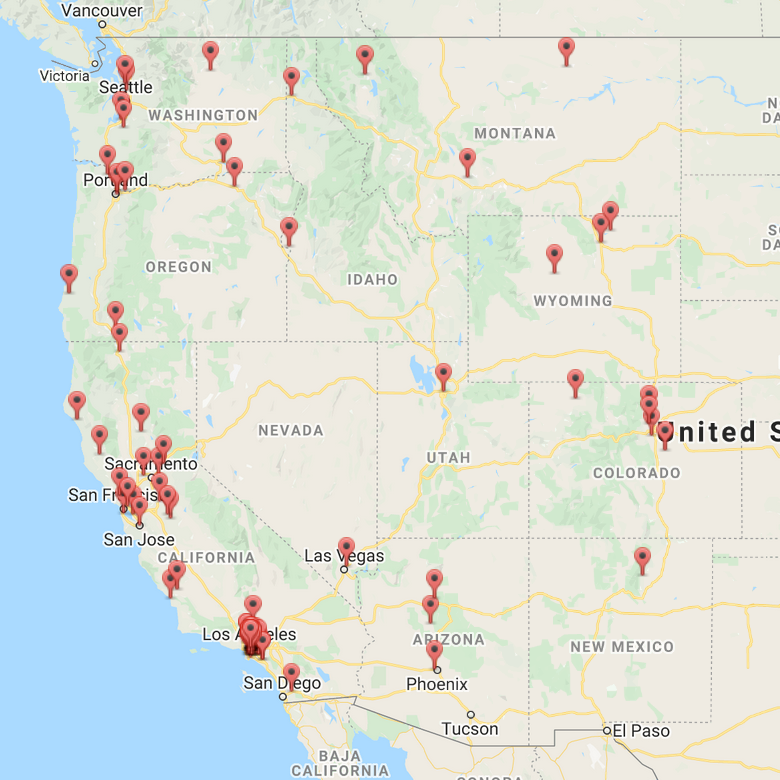
To assess the landscape of existing textile manufacturing, we created maps of Western textile manufacturers, Western cut-and-sew operations, Central and North American textile manufacturers, and California cotton gins. The maps and databases illuminate broad themes that inform our understanding of the textile manufacturing system as a whole.
Much of the data come from paid industry directories such as Davison’s Textile Blue Book and Maker’s Row. While we can’t share this data directly with the public, we recommend checking out those resources as well as free resources provided by Cotton Inc., the American Sheep Industry Association, the Global Organic Textile Standard, the California Cotton Ginners and Growers Association, and Fibershed’s existing National Mill Inventory.
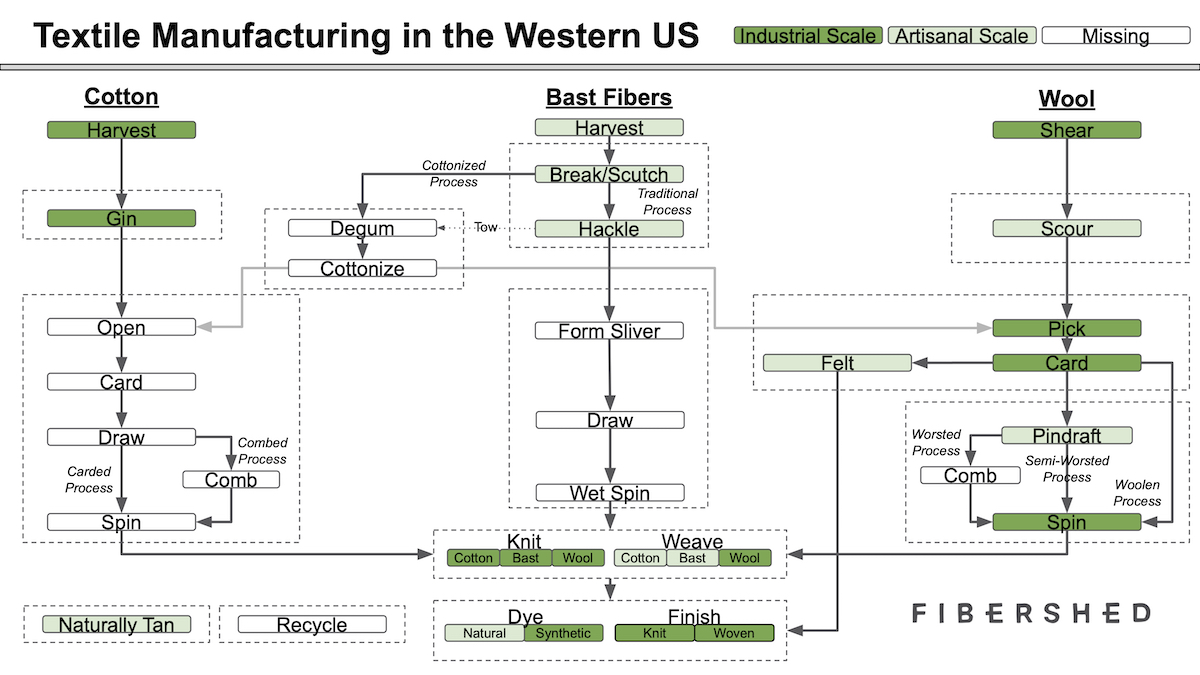
Based on this data, we created a diagram (shown at the beginning of this blog) that shows the processing steps required to produce fabric from raw cotton, bast fibers, and wool and identifies the existing scale of operation for each step by color to highlight gaps. The schematic also includes recycling and tanning.
Here, we highlight the following findings:
- Location: The United States houses about ⅔ of the listed textile manufacturers from North and Central America. These manufacturers cluster in the Southeast and Northeast, leaving large gaps in the West. In the West, the most developed industries are in the Los Angeles area. In particular, Los Angeles and Orange Counties account for about 60% of manufacturers in the West, primarily represented by knitting, dyeing/finishing, and cut-and-sew operations.
- Wool: The West produces most of the nation’s wool. This fiber has the most developed industrial manufacturing system in our region but lacks critical scouring, felting, and top-making facilities.
- Cotton: Western cotton production focuses on pima cotton in California, which produces about 90% of the US’s supply of that fiber. While cotton harvesting, ginning, and knitting exist at scale in the West, we lack industrial spinning and weaving for the fiber.
- Bast fibers: We are only beginning to grow and process bast fibers at a large scale in the West, given the recent legalization of hemp and the relative newness of efforts to revitalize flax production. Expansions are underway.
- Weaving: We lack large-scale weaving for plant fibers like cotton, linen, and hemp.
- Dyeing: In the West, we have a well-established industry for synthetic dyes but lack natural dyeing at industrial scales.
- Tanning: While we have industrial synthetic tanning for hair-on hides in the West, we lack natural tanning for all forms of leather beyond the artisanal scale.
- Recycling: The West lacks industrial fiber recycling capabilities, the technologies for which are largely still in development.
The Empire’s New Clothes: How we got here
Industrial textile manufacturing was imported to the United States from England during the Industrial Revolution, starting with cotton and wool factories in New England in the late 18th century. The Northeast served as the center of the U.S. textile industry until it was eventually eclipsed by the Southeast after the Civil War, partly due to the exploitation of cheap labor in the wake of the upheaval.
Employment numbers in both the textile and apparel (cut-and-sew) industries reached all-time highs in the 20th century and were followed thereafter by steady declines. The declines accelerated in the 1990s and 2000s with the North American Free Trade Agreement and other manifestations of globalization. According to data from the Bureau of Labor Statistics, employment in the textile industry peaked in 1948 with 1.3 million jobs, and in the apparel industry peaked with 1.4 million employees in 1973. The subsequent declines stemmed from both automation and competition from cheaper imports.
Cheap imports played a particularly large role starting in the 1990s. According to a 2013 article from the New York Times, the “North American Free Trade Agreement in 1994 was the first blow, erasing import duties on much of the apparel produced in Mexico. The Asian financial crisis in the late 1990s, when currencies collapsed, added a 30 to 40 percent discount to already cheaper overseas products, textile executives said. China joined the World Trade Organization in 2001 and quickly became an apparel powerhouse, and as of 2005, the W.T.O. eliminated textile quotas.”
While most manufacturing industries in the US were strongly affected by globalization, the textile and apparel sectors experienced particularly dramatic declines, with current employment numbers representing about 8% of their historic highs. Similarly, whereas most manufacturing industries have experienced net increases in production capacity due to greater efficiency and despite their labor losses, efficiency gains in textiles and apparel have not been enough to offset offshoring: In 2013, American textile and apparel industries still produced 33% and 81% less than they did in 1990.
Closing the loops: Where do we go from here?
Based on our interviews and on-going conversations, we see many opportunities for building soil-to-soil systems in the West. In the near term, we see particular opportunities to close the gaps for wool, bast fibers, and natural tanning.
Using insights from our ecosystem mapping as a foundation, the RFMI is now engaging our committees to develop solutions that leverage the resources available to us and address key gaps in the regional soil-to-soil cycle. Stayed tuned for our next blog, sharing some of the key themes and examples we’re using to guide and inspire our efforts.